

PLACEHOLDER: entity-relationship style diagram. Left: Agent emits Traces (with child Spans and Tool calls), Traces group into Sessions. Middle: Patterns and Online Evaluators read Traces/Sessions and raise Signals. Right: Datasets (Questions + criteria) drive Evaluation Runs producing Results with ratings. Bottom: Prompts and Tool Schemas registries receive evidence from Signals and Results.

Find out what people are talking about.

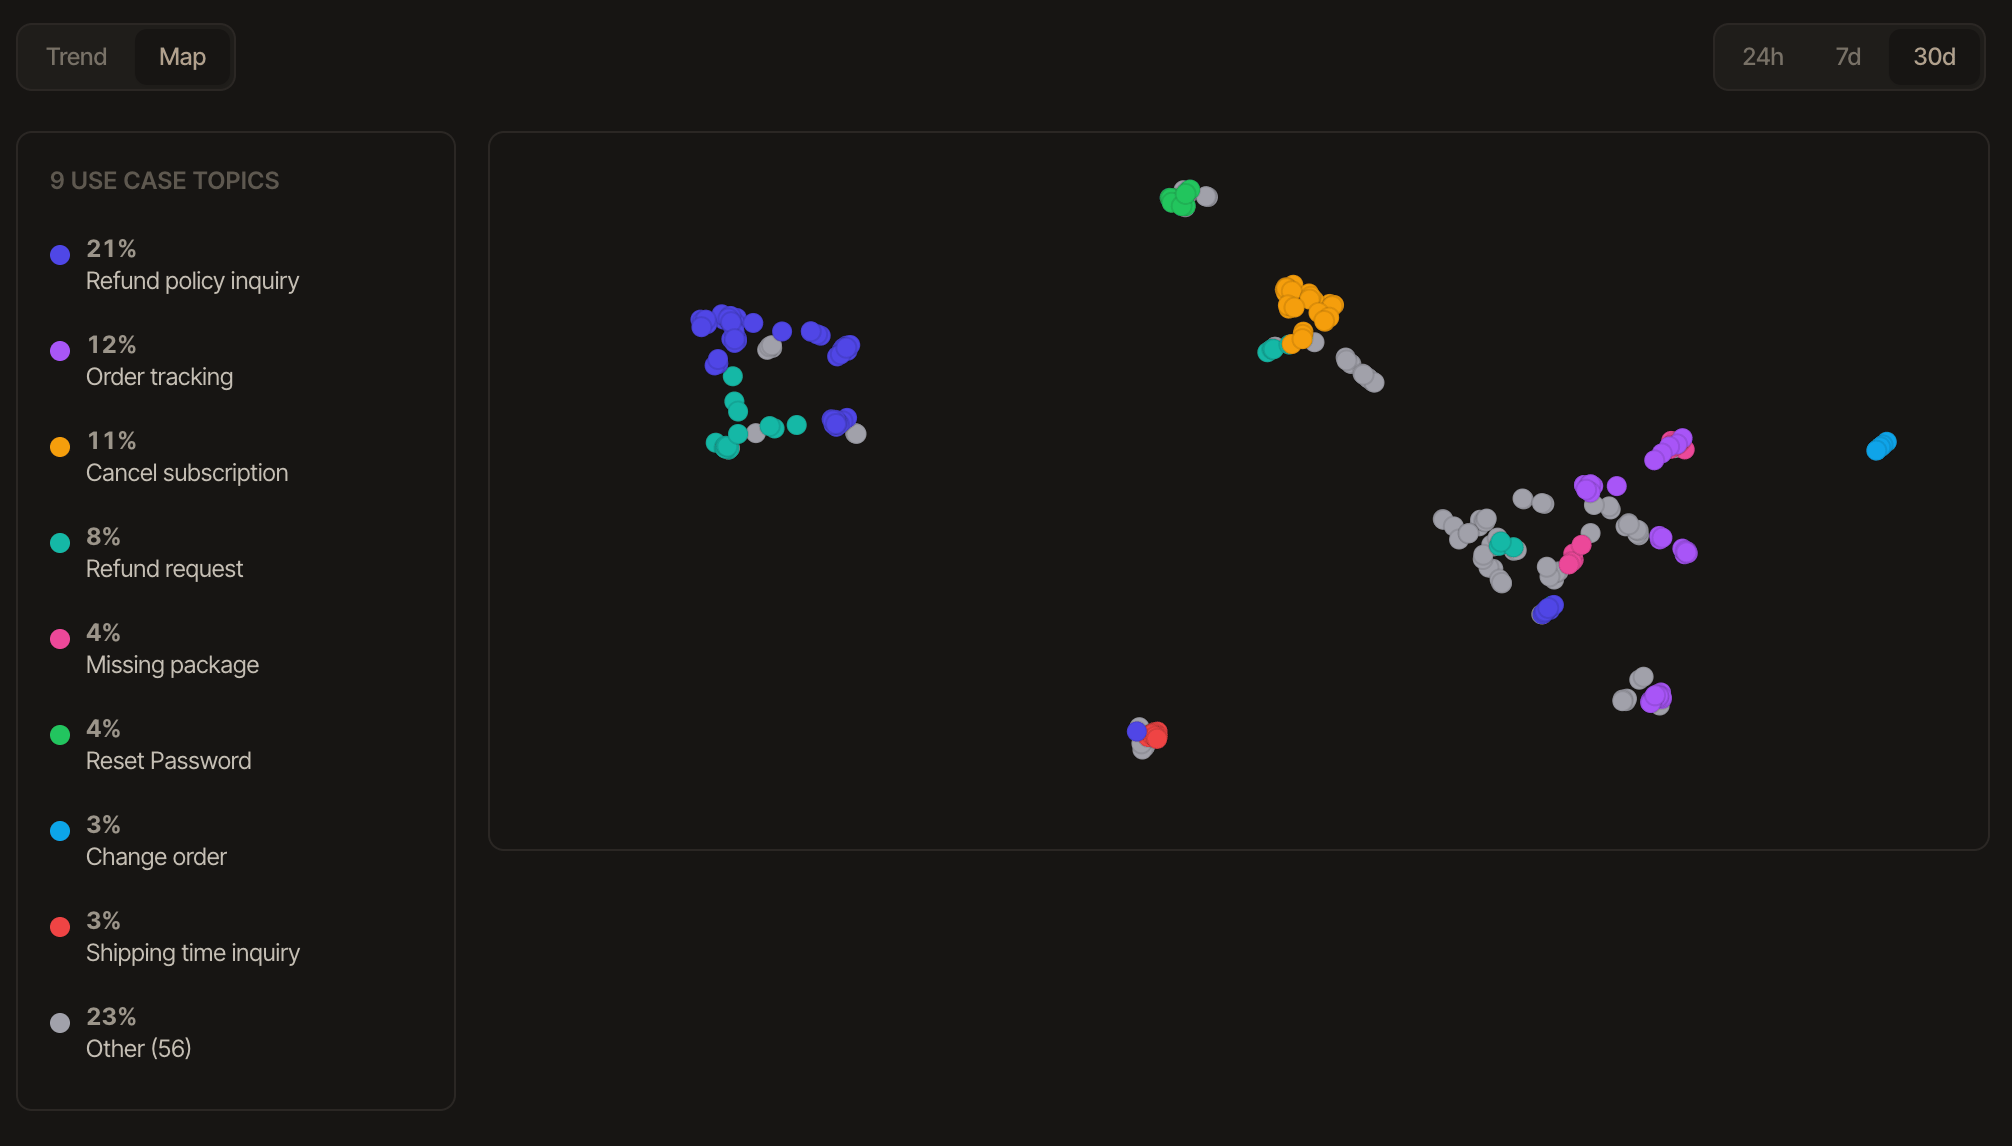
Monitor tells you when your agent fails; Topics tells you what people actually ask it. When enabled, an LLM classifier assigns each monitored trace a short topic label, clustered and shown as Overview’s topic map and the dashboard’s own Topics tab - the fastest way to see that 40% of traffic is about one thing your prompt barely covers. It’s off by default (every classification is an LLM call against your key): turn it on in Platform Settings → Monitoring Defaults → Topics, a single project-level toggle. Classification is per trace, not per session, since a topic describes an individual request.